Simulation Support for the Energy Megagame
Latest event : Lund, 06 February 2022
How does the simulation process work?
In order to provide a degree of realism and project the impact of the decisions taken in the game, we use simulation support. OpenModelica is the tool used to generate the simulation results for the game. The input data (solar irradiance, wind speed, hydropower production capacity and nuclear power production capacity for the region, household demand and amount of different types of vehicles) is collected for the Östergotland region. This data is pre-processed in Python based on the decisions taken in the game and provided to the physical models in Modelica to then obtain the CO2 production, total energy production and other KPIs. The data is then again processed in Python to generate the result graphs.
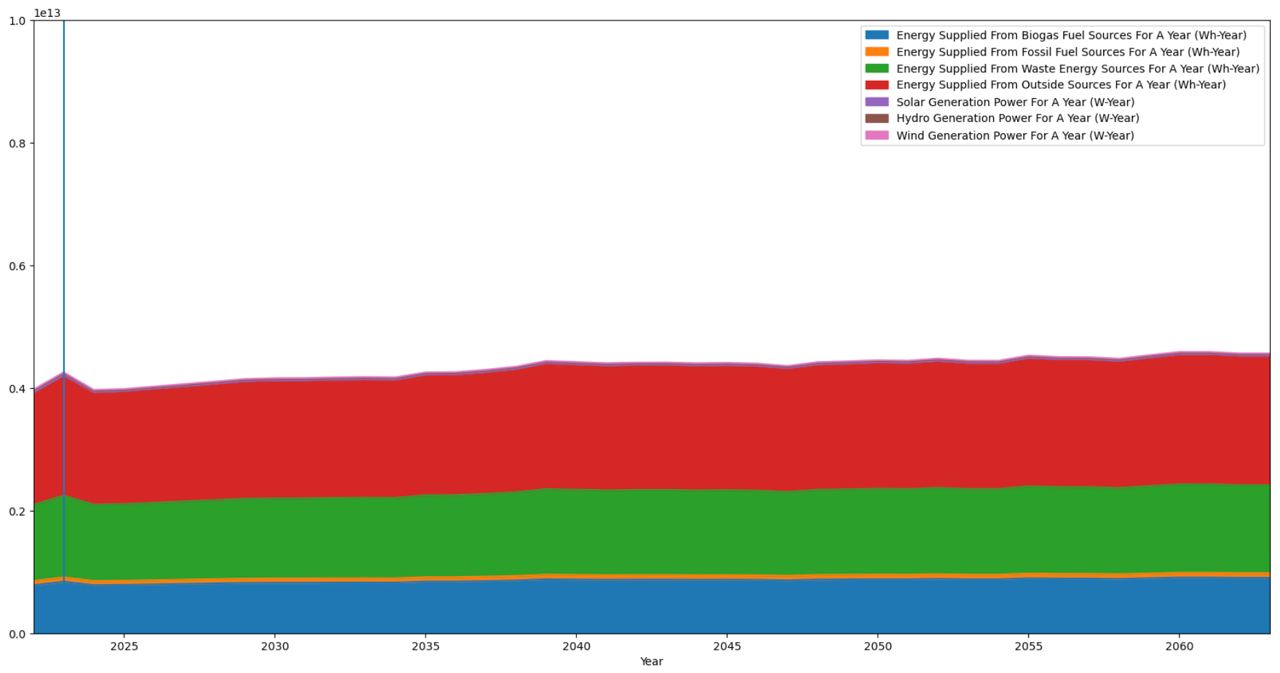
Example of energy usage projections based on current trends, the blue line marks the current year:
The models used in the game are from the TransportationModel and ThermalAndPowerGridSystem libraries.


How is the data generated?
At the beginning the models are parametrised based on the current data from Sweden and from Östergötland, and future trends are extrapolated based on current plans (eg: 32 new turbines planned in Östergötland expected to double energy production) and trends based on previous history (eg: growth in energy demand over previous years for all of Sweden are used to estimate the growth in demand for Östergötland).
The data used is taken from different sources, some data is not available in the exact format needed for the simulation, so some approximations are made (eg: wind speed and solar irradiation are calculated as an average based on several location points from the Nasa site because there is no single value available for the whole region).
Solar panel numbers are taken from Hemsol and trends from Energimyndigheten
Hydropower information is take from Tekniskaverken and Statistik Databasen.
Consumption trends are calculated based on the data available on Mimer and Regionfakta.
At the beginning the models are parametrised based on the current real world status and this data is extrapolated on the next 40 years.
After every round the data for the future is adjusted based on the decisions taken in the game, for example the increase or decrease in public and personal transport, the type of energy used by the population. These changes are considered by counting the cards of different types on the boards and comparing the numbers with the previous rounds.
Some changes are non instantaneous, for example a decision of building a new solar farm will have an effect delayed by 3 years.
After the simulation, the results from the energy grid and transport models are aggregated to compute total energy usage and CO2 emissions.
The next step is to integrate the Wordl3 model into the simulation, to keep track of KPIs on life quality.
Want to find out more?
If you have more questions or feedback about the simulation please contact Lena Buffoni.
For further reading, here are some resources:
Peter Fritzson, Adrian Pop, Lena Buffoni,, et al (2020). The OpenModelica Integrated Environment for Modeling, Simulation, and Model-Based Development. Modeling, Identification and Control, 41(4):241—295.
Lena Buffoni, Lennart Ochel, Adrian Pop, Peter Fritzson, Niklas Fors, Görel Hedin, Walid Taha, and Martin Sjölund. Open Source Languages and Methods for Cyber-Physical System Development: Overview and Case Studies Electronics 10, no. 8: 902., April 2021, doi
Peter Fritzson. Principles of Object Oriented Modeling and Simulation with Modelica 3.3: A Cyber-Physical Approach. 1250 pages. ISBN 9781-118-859124, Wiley IEEE Press, 2014.
Meadows, D. H., Randers, J., & Meadows, D. L. (2004). Limits to Growth – The 30 Year Update.
Randers J, Rockström J, Stoknes P-E, et al (2019). Achieving the 17 Sustainable Development Goals within 9 planetary boundaries. Global Sustainability 2, e24, 1–11. doi
Modelica Association. Modelica – A Unified Object-Oriented Language for Systems Modeling, Language Specification Version 3.5. February 18, 2021. www.modelica.org