OMEdit – OpenModelica Connection Editor
OMEdit – OpenModelica Connection Editor is the new Graphical User Interface for graphical model editing in OpenModelica. It is implemented in C++ using the Qt graphical user interface library and supports the Modelica Standard Library that is included in the latest OpenModelica installation. This chapter gives a brief introduction to OMEdit and also demonstrates how to create a DCMotor model using the editor.
OMEdit provides several user friendly features for creating, browsing, editing, and simulating models:
- Modeling – Easy model creation for Modelica models.
- Pre-defined models – Browsing the Modelica Standard library to
- access the provided models.
- User defined models – Users can create their own models for
- immediate usage and later reuse.
- Component interfaces – Smart connection editing for drawing and
- editing connections between model interfaces.
- Simulation – Subsystem for running simulations and specifying
- simulation parameters start and stop time, etc.
- Plotting – Interface to plot variables from simulated models.
Starting OMEdit
A splash screen similar to the one shown in Figure 5 will appear indicating that it is starting OMEdit. The executable is found in different places depending on the platform (see below).
Figure 5 OMEdit Splash Screen.
Microsoft Windows
OMEdit can be launched using the executable placed in OpenModelicaInstallationDirectory/bin/OMEdit/OMEdit.exe. Alternately, choose OpenModelica > OpenModelica Connection Editor from the start menu in Windows.
Linux
Start OMEdit by either selecting the corresponding menu application item or typing “OMEdit” at the shell or command prompt.
Mac OS X
The default installation is /Application/MacPorts/OMEdit.app.
MainWindow & Browsers
The MainWindow contains several dockable browsers,
- Libraries Browser
- Documentation Browser
- Variables Browser
- Messages Browser
Figure 6 shows the MainWindow and browsers.
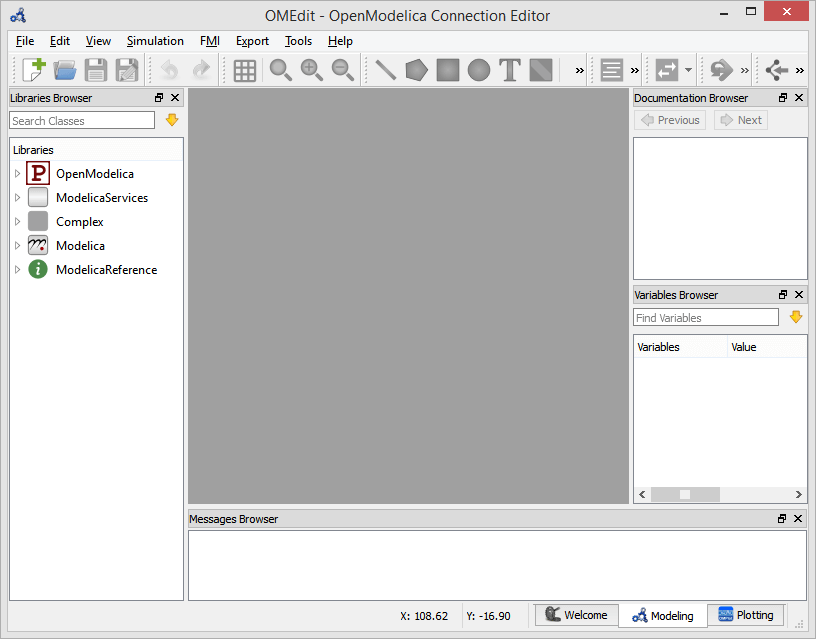
Figure 6 OMEdit MainWindow and Browsers.
The default location of the browsers are shown in Figure 6. All browsers except for Message Browser can be docked into left or right column. The Messages Browser can be docked into top or bottom areas. If you want OMEdit to remember the new docked position of the browsers then you must enable Preserve User's GUI Customizations option, see section General.
Filter Classes
To filter a class click Edit > Filter Classes or press keyboard shortcut Ctrl+Shift+F. The loaded Modelica classes can be filtered by typing any part of the class name.
Libraries Browser
To view the Libraries Browser click View > Windows > Libraries Browser. Shows the list of loaded Modelica classes. Each item of the Libraries Browser has right click menu for easy manipulation and usage of the class. The classes are shown in a tree structure with name and icon. The protected classes are not shown by default. If you want to see the protected classes then you must enable the Show Protected Classes option, see section General.
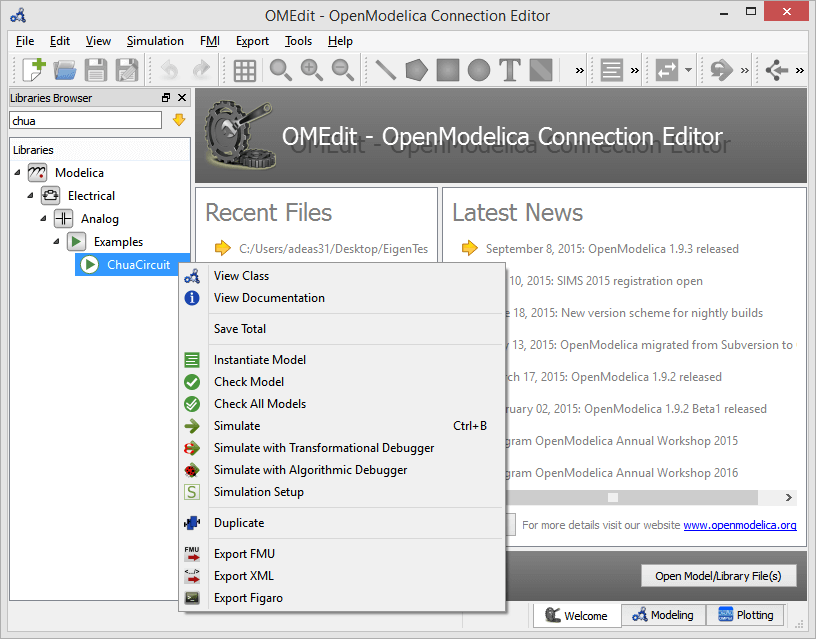
Figure 7 Libraries Browser.
Documentation Browser
Displays the HTML documentation of Modelica classes. It contains the navigation buttons for moving forward and backward. It also contains a WYSIWYG editor which allows writing class documentation in HTML format. To see documentation of any class, right click the Modelica class in Libraries Browser and choose View Documentation.
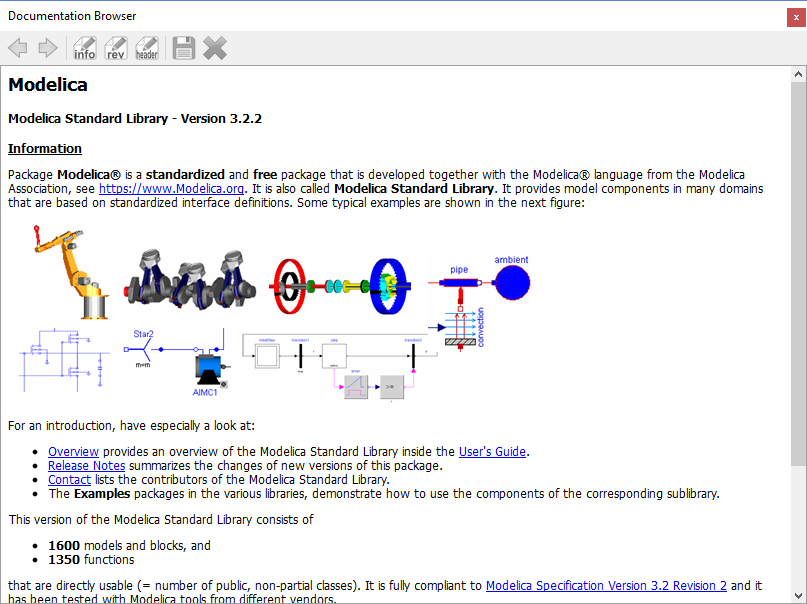
Figure 8 Documentation Browser.
Variables Browser
The class variables are structured in the form of the tree and are displayed in the Variables Browser. Each variable has a checkbox. Ticking the checkbox will plot the variable values. There is a find box on the top for filtering the variable in the tree. The filtering can be done using Regular Expression, Wildcard and Fixed String. The complete Variables Browser can be collapsed and expanded using the Collapse All and Expand All buttons.
The browser allows manipulation of changeable parameters for Re-simulating a Model. It also displays the unit and description of the variable.
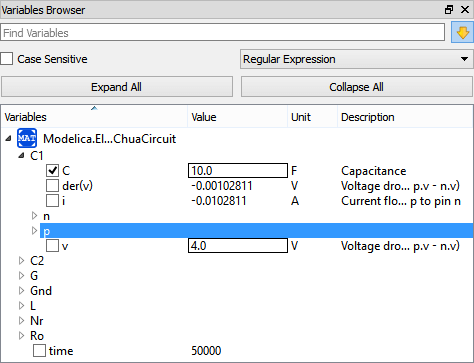
Figure 9 Variables Browser.
Perspectives
The perspective tabs are loacted at the bottom right of the MainWindow:
- Welcome Perspective
- Modeling Perspective
- Plotting Perspective
- Debugging Perspective
Welcome Perspective
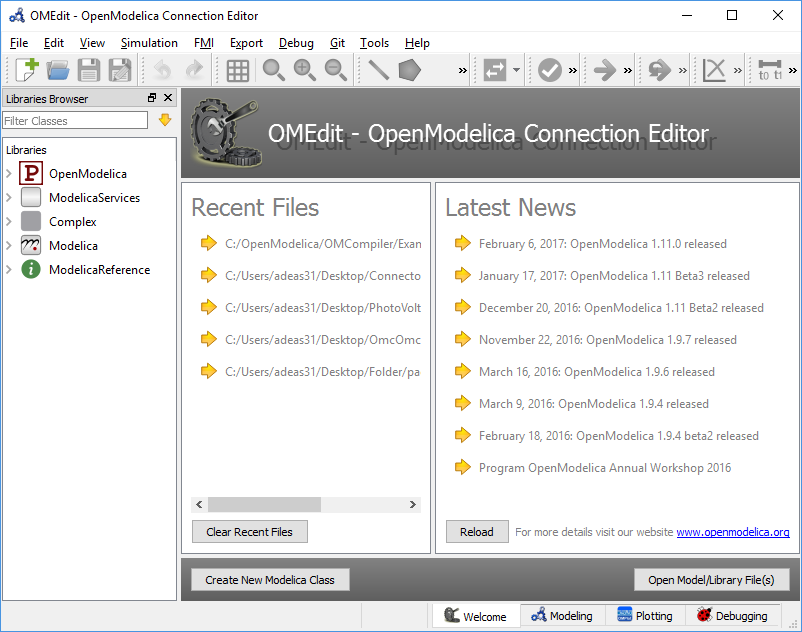
Figure 10 OMEdit Welcome Perspective.
The Welcome Perspective shows the list of recent files and the list of latest news from https://www.openmodelica.org/. See Figure 10. The orientation of recent files and latest news can be horizontal or vertical. User is allowed to show/hide the latest news. See section General.
Modeling Perspective
The Modeling Perpective provides the interface where user can create and design their models. See Figure 11.
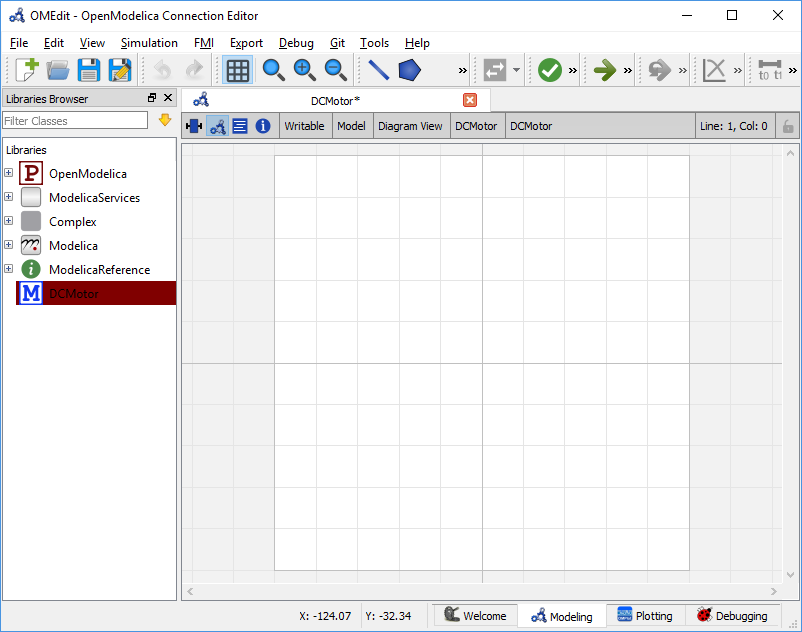
Figure 11 OMEdit Modeling Perspective.
The Modeling Perspective interface can be viewed in two different modes, the tabbed view and subwindow view, see section General.
Plotting Perspective
The Plotting Perspective shows the simulation results of the models. Plotting Perspective will automatically become active when the simulation of the model is finished successfully. It will also become active when user opens any of the OpenModelica’s supported result file. Similar to Modeling Perspective this perspective can also be viewed in two different modes, the tabbed view and subwindow view, see section General.
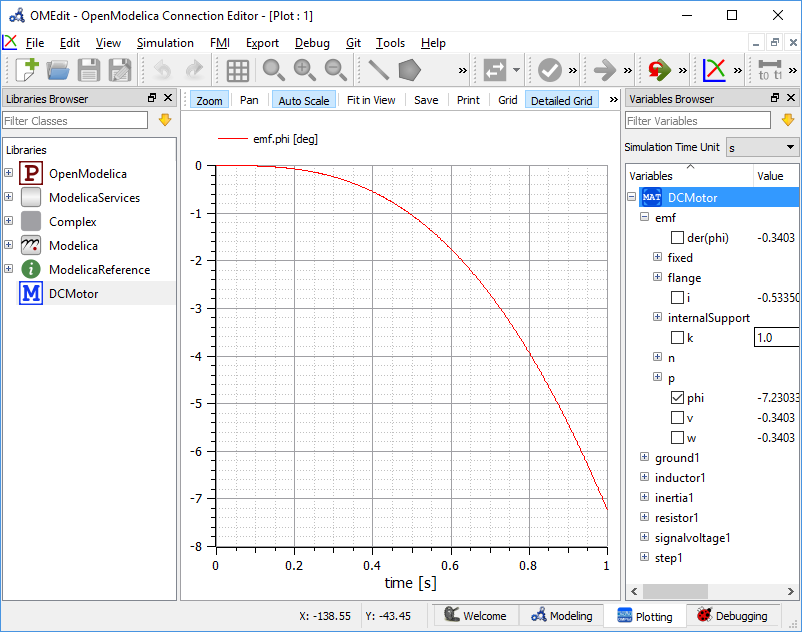
Figure 12 OMEdit Plotting Perspective.
Debugging Perspective
The application automatically switches to Debugging Perpective when user simulates the class with algorithmic debugger. The prespective shows the list of stack frames, breakpoints and variables.
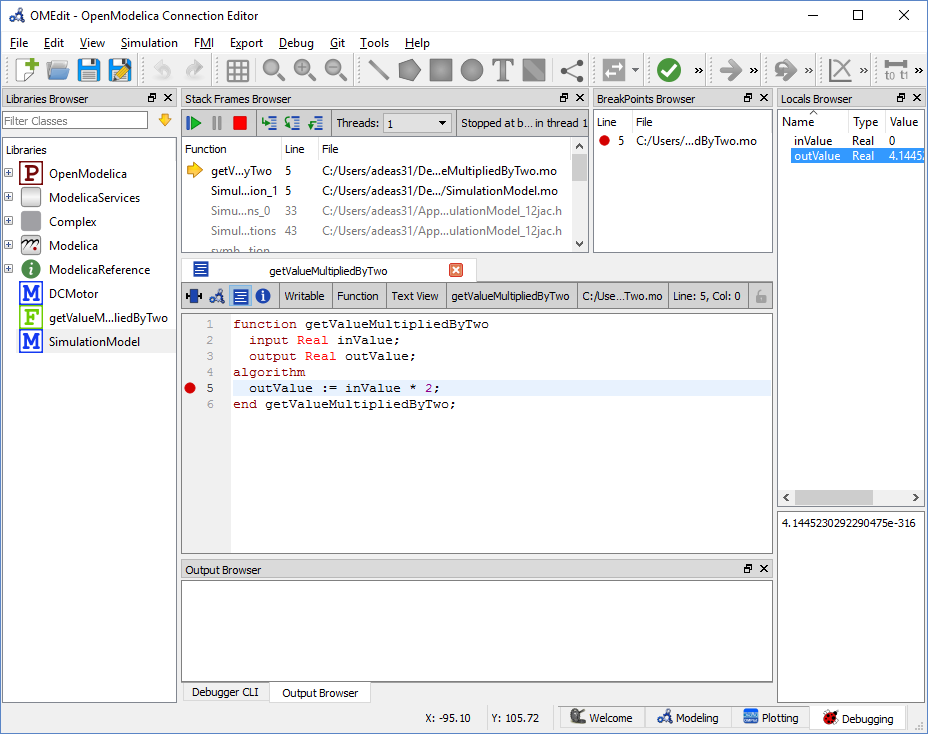
Figure 13 OMEdit Debugging Perspective.
Modeling a Model
Creating a New Modelica Class
Creating a new Modelica class in OMEdit is rather straightforward. Choose any of the following methods,
- Select File > New Modelica Class from the menu.
- Click on New Modelica Class toolbar button.
- Click on the Create New Modelica Class button available at the left bottom of Welcome Perspective.
- Press Ctrl+N.
Opening a Modelica File
Choose any of the following methods to open a Modelica file,
- Select File > Open Model/Library File(s) from the menu.
- Click on Open Model/Library File(s) toolbar button.
- Click on the Open Model/Library File(s) button available at the right bottom of Welcome Perspective.
- Press Ctrl+O.
(Note, for editing Modelica system files like MSL (not recommended), see Editing Modelica Standard Library)
Opening a Modelica File with Encoding
Select File > Open/Convert Modelica File(s) With Encoding from the menu. It is also possible to convert files to UTF-8.
Model Widget
For each Modelica class one Model Widget is created. It has a statusbar and a view area. The statusbar contains buttons for navigation between the views and labels for information. The view area is used to display the icon, diagram and text layers of Modelica class. See Figure 14.
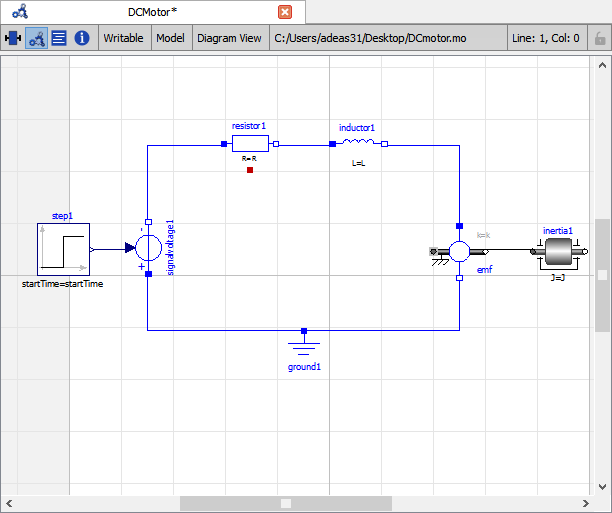
Figure 14 Model Widget showing the Diagram View.
Adding Component Models
Drag the models from the Libraries Browser and drop them on either Diagram or Icon View of Model Widget.
Making Connections
In order to connect one component model to another the user first needs
to enable the connect mode ( ) from the toolbar.
Move the mouse over the connector. The mouse cursor will change from arrow cursor to cross cursor. To start the connection press left button and move while keeping the button pressed. Now release the left button. Move towards the end connector and click when cursor changes to cross cursor.
Simulating a Model
The OMEdit Simulation Dialog can be launched by,
- Selecting Simulation > Simulation Setup from the menu. (requires a model to be active in ModelWidget)
- Clicking on the Simulation Setup toolbar button. (requires a model to be active in ModelWidget)
- Right clicking the model from the Libraries Browser and choosing Simulation Setup.
General Tab
- Simulation Interval
- Start Time – the simulation start time.
- Stop Time – the simulation stop time.
- Number of Intervals – the simulation number of intervals.
- Interval – the length of one interval (i.e., stepsize)
- Simulate with steps (makes the interactive simulation synchronous; plots nicer curves at the expense of performance)
- Simulation server port
- Integration
- Method – the simulation solver. See section Integration Methods for solver details.
- Tolerance – the simulation tolerance.
- Jacobian - the jacobain method to use.
- DASSL/IDA Options
- Root Finding - Activates the internal root finding procedure of dassl.
- Restart After Event - Activates the restart of dassl after an event is performed.
- Initial Step Size
- Maximum Step Size
- Maximum Integration Order
- Compiler Flags (Optional) – the optional C compiler flags.
- Number of Processors – the number of processors used to build the simulation.
- Build Only – only builds the class.
- Launch Transformational Debugger – launches the transformational debugger.
- Launch Algorithmic Debugger – launches the algorithmic debugger.
- Launch Animation – launches the 3d animation window.
Output Tab
- Output Format – the simulation result file output format.
- File Name Prefix (Optional) – the name is used as a prefix for the output files.
- Result File (Optional) - the simulation result file name.
- Variable Filter (Optional)
- Protected Variables – adds the protected variables in result file.
- Equidistant Time Grid – output the internal steps given by dassl instead of interpolating results into an equidistant time grid as given by stepSize or numberOfIntervals
- Store Variables at Events – adds the variables at time events.
- Show Generated File – displays the generated files in a dialog box.
Simulation Flags Tab
- Model Setup File (Optional) – specifies a new setup XML file to the generated simulation code.
- Initialization Method (Optional) – specifies the initialization method.
- Equation System Initialization File (Optional) – specifies an external file for the initialization of the model.
- Equation System Initialization Time (Optional) – specifies a time for the initialization of the model.
- Clock (Optional) – the type of clock to use.
- Linear Solver (Optional) – specifies the linear solver method.
- Non Linear Solver (Optional) – specifies the nonlinear solver.
- Linearization Time (Optional) – specifies a time where the linearization of the model should be performed.
- Output Variables (Optional) – outputs the variables a, b and c at the end of the simulation to the standard output.
- Profiling – creates a profiling HTML file.
- CPU Time – dumps the cpu-time into the result file.
- Enable All Warnings – outputs all warnings.
- Logging (Optional)
- LOG_DASSL - additional information about dassl solver.
- LOG_DASSL_STATES - outputs the states at every dassl call.
- LOG_DEBUG - additional debug information.
- LOG_DSS - outputs information about dynamic state selection.
- LOG_DSS_JAC - outputs jacobian of the dynamic state selection.
- LOG_DT - additional information about dynamic tearing.
- LOG_EVENTS - additional information during event iteration.
- LOG_EVENTS_V - verbose logging of event system.
- LOG_INIT - additional information during initialization.
- LOG_IPOPT - information from Ipopt.
- LOG_IPOPT_FULL - more information from Ipopt.
- LOG_IPOPT_JAC - check jacobian matrix with Ipopt.
- LOG_IPOPT_HESSE - check hessian matrix with Ipopt.
- LOG_IPOPT_ERROR - print max error in the optimization.
- LOG_JAC - outputs the jacobian matrix used by dassl.
- LOG_LS - logging for linear systems.
- LOG_LS_V - verbose logging of linear systems.
- LOG_NLS - logging for nonlinear systems.
- LOG_NLS_V - verbose logging of nonlinear systems.
- LOG_NLS_HOMOTOPY - logging of homotopy solver for nonlinear systems.
- LOG_NLS_JAC - outputs the jacobian of nonlinear systems.
- LOG_NLS_JAC_TEST - tests the analytical jacobian of nonlinear systems.
- LOG_NLS_RES - outputs every evaluation of the residual function.
- LOG_NLS_EXTRAPOLATE - outputs debug information about extrapolate process.
- LOG_RES_INIT - outputs residuals of the initialization.
- LOG_RT - additional information regarding real-time processes.
- LOG_SIMULATION - additional information about simulation process.
- LOG_SOLVER - additional information about solver process.
- LOG_SOLVER_CONTEXT - context information during the solver process.
- LOG_SOTI - final solution of the initialization.
- LOG_STATS - additional statistics about timer/events/solver.
- LOG_STATS_V - additional statistics for LOG_STATS.
- LOG_UTIL.
- LOG_ZEROCROSSINGS - additional information about the zerocrossings.
- Additional Simulation Flags (Optional) – specify any other simulation flag.
Archived Simulations Tab
Shows the list of simulations already finished or running. Double clicking on any of them opens the simulation output window.
Plotting the Simulation Results
Successful simulation of model produces the result file which contains the instance variables that are candidate for plotting. Variables Browser will show the list of such instance variables. Each variable has a checkbox, checking it will plot the variable. See Figure 12.
Types of Plotting
The plotting type depends on the active Plot Window. By default the plotting type is Time Plot.
Time Plot
Plots the variable over the simulation time. You can have multiple Time
Plot windows by clicking on New Plot Window toolbar button ( ).
).
Plot Parametric
Draws a two-dimensional parametric diagram, between variables x and y,
with y as a function of x. You can have multiple Plot Parametric
windows by clicking on the New Plot Parametric toolbar button ( ).
).
Array Plot
Plots an array variable so that the array elements' indexes are on the x-axis and corresponding
elements' values are on the y-axis. The time is controlled by the slider above the variable tree.
When an array is present in the model, it has a principal array node in the variable tree.
To plot this array as an Array Plot, match the principal node. The principal node may be expanded
into particular array elements. To plot a single element in the Time Plot, match the element.
A new Array Plot window is opened using the New Array Plot Window toolbar button ( ).
).
Array Parametric Plot
Plots the first array elements' values on the x-axis versus the second array elements' values on the y-axis. The time
is controlled by the slider above the variable tree. To create a new Array Parametric Plot, press
the New Array Parametric Plot Window toolbar button ( ), then match the principle
array node in the variable tree view to be plotted on the x-axis and match the principle array node to be plotted
on the y-axis.
), then match the principle
array node in the variable tree view to be plotted on the x-axis and match the principle array node to be plotted
on the y-axis.
Re-simulating a Model
The Variables Browser allows manipulation of changeable
parameters for re-simulation.
After changing the parameter values user can click on the re-simulate
toolbar button ( ), or right click the model in Variables Browser and choose
re-simulate from the menu.
), or right click the model in Variables Browser and choose
re-simulate from the menu.
3D Visualization
Since OpenModelica 1.11 , OMEdit has built-in 3D visualization, which replaces third-party libraries (such as Modelica3D) for 3D visualization.
The 3d visualization is based on OpenSceneGraph. In order to run the visualization simply right click the class in Libraries Browser an choose “Simulate with Animation” as shown in Figure 15.
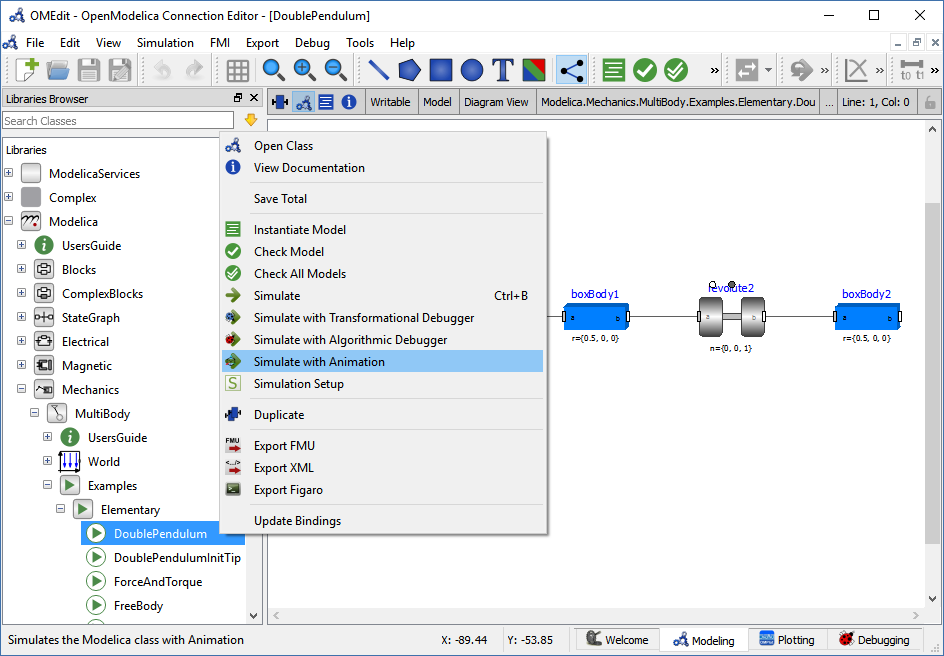
Figure 15 OMEdit Simulate with Animation.
One can also run the visualization via Simulation > Simulate with Animation from the menu.
When simulating a model in animation mode, the flag +d=visxml is set. Hence, the compiler will generate a scene description file _visual.xml which stores all information on the multibody shapes. This scene description references all variables which are needed for the animation of the multibody system. When simulating with +d=visxml, the compiler will always generate results for these variables.
After the successful simulation of the model, the visualization window will show up automatically as shown in Figure 16.
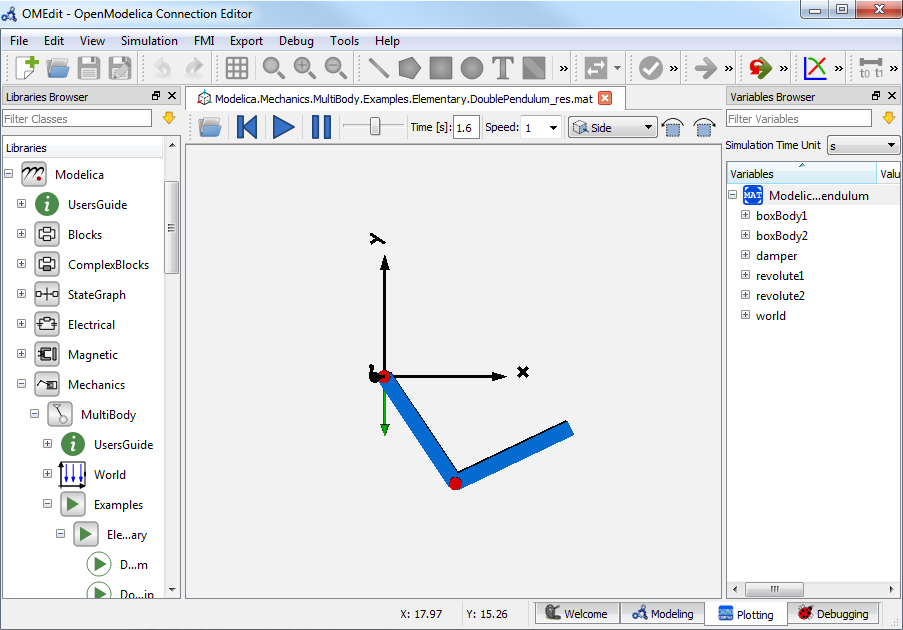
Figure 16 OMEdit 3D Visualization.
The animation starts with pushing the play button. The animation is played until stopTime or until the pause button is pushed. By pushing the previous button, the animation jumps to the initial point of time. Points of time can be selected by moving the time slider or by inserting a simulation time in the Time-box. The speed factor of animation in relation to realtime can be set in the Speed-dialog. Other animations can be openend by using the open file button and selecting a result file with a corresping scene description file.
The 3D camera view can be manipulated as follows:
| Operation | Key | Mouse Action |
|---|---|---|
| Move Closer/Further | none | Wheel |
| Move Closer/Further | Right Mouse Hold | Up/Down |
| Move Up/Down/Left/Right | Middle Mouse Hold | Move Mouse |
| Move Up/Down/Left/Right | Left and Right Mouse Hold | Move Mouse |
| Rotate | Left Mouse Hold | Move Mouse |
| Shape context menu | Right Mouse + Shift |
Predefined views (Isometric, Side, Front, Top) can be selected and the scene can be tilted by 90° either clock or anticlockwise with the rotation buttons.
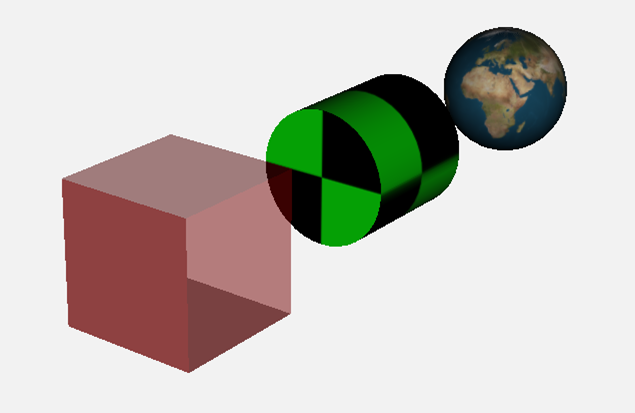
The shapes that are displayed in the viewer can be selected with shift + right click. If a shape is selected, a context menu pops up that offers additional visualization features
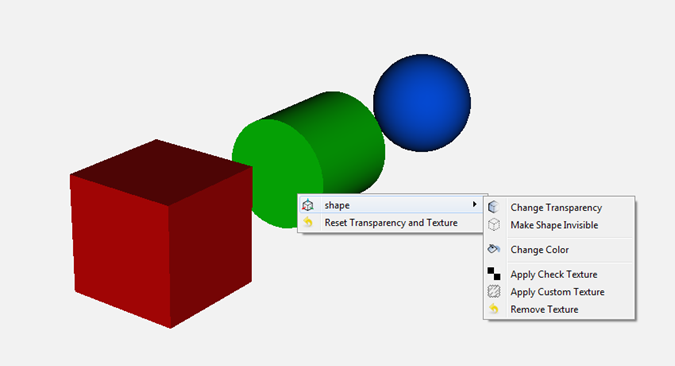
The following features can be selected:
| Menu | Description |
|---|---|
| Change Transparency | The shape becomes either transparent or intransparent. |
| Make Shape Invisible | The shape becomes invisible. |
| Change Color | A color dialog pops up and the color of the shape can be set. |
| Apply Check Texture | A checked texture is applied to the shape. |
| Apply Custom Texture | A file selection dialog pops up and an image file can be selected as a texture. |
| Remove Texture | Removes the current texture of the shape. |
Interactive Simulation
Warning
Interactive simulation is an experimental feature.
Interactive simulation is enabled by selecting interactive simulation in the General tab of the simulation settings.
There are two main modes of execution: asynchronous and synchronous (simulate with steps). The difference is that in synchronous (step mode), OMEdit sends a command to the simulation for each step that the simulation should take. The asynchronous mode simply tells the simulation to run and samples variables values in real-time; if the simulation runs very fast, fewer values will be sampled.
When running in asynchronous mode, it is possible to simulate the model in real-time (with a scaling factor just like simulation flag -rt, but with the ability to change the scaling factor during the interactive simulation). In the synchronous mode, the speed of the simulation does not directly correspond to real-time.
How to Create User Defined Shapes – Icons
Users can create shapes of their own by using the shape creation tools available in OMEdit.
- Line Tool – Draws a line. A line is created with a minimum of two
- points. In order to create a line, the user first selects the line tool from the toolbar and then click on the Icon/Diagram View; this will start creating a line. If a user clicks again on the Icon/Diagram View a new line point is created. In order to finish the line creation, user has to double click on the Icon/Diagram View.
- Polygon Tool – Draws a polygon. A polygon is created in a similar
- fashion as a line is created. The only difference between a line and a polygon is that, if a polygon contains two points it will look like a line and if a polygon contains more than two points it will become a closed polygon shape.
- Rectangle Tool – Draws a rectangle. The rectangle only contains two
- points where first point indicates the starting point and the second point indicates the ending the point. In order to create rectangle, the user has to select the rectangle tool from the toolbar and then click on the Icon/Diagram View, this click will become the first point of rectangle. In order to finish the rectangle creation, the user has to click again on the Icon/Diagram View where he/she wants to finish the rectangle. The second click will become the second point of rectangle.
- Ellipse Tool – Draws an ellipse. The ellipse is created in a
- similar way as a rectangle is created.
- Text Tool – Draws a text label.
- Bitmap Tool – Draws a bitmap container.
The shape tools are located in the toolbar. See Figure 19.
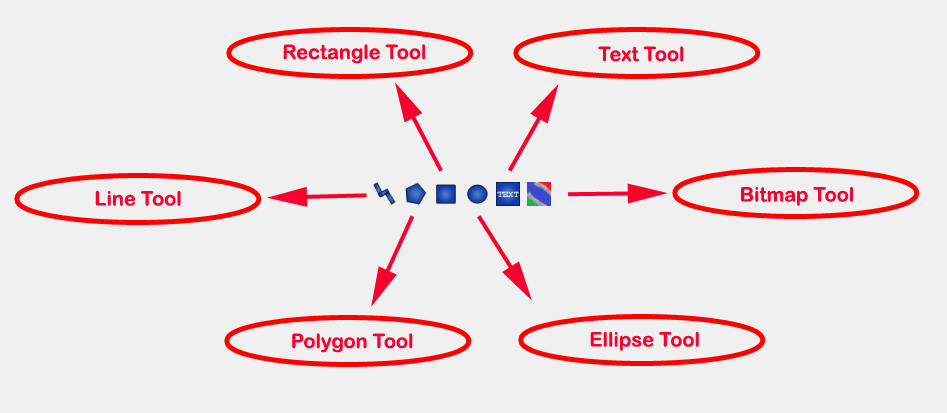
Figure 19 User defined shapes.
The user can select any of the shape tools and start drawing on the Icon/Diagram View. The shapes created on the Diagram View of Model Widget are part of the diagram and the shapes created on the Icon View will become the icon representation of the model.
For example, if a user creates a model with name testModel and add a rectangle using the rectangle tool and a polygon using the polygon tool, in the Icon View of the model. The model’s Modelica Text will appear as follows:
model testModel
  annotation(Icon(graphics = {Rectangle(rotation = 0, lineColor = {0,0,255}, fillColor = {0,0,255}, pattern = LinePattern.Solid, fillPattern = FillPattern.None, lineThickness = 0.25, extent = {{ -64.5,88},{63, -22.5}}),Polygon(points = {{ -47.5, -29.5},{52.5, -29.5},{4.5, -86},{ -47.5, -29.5}}, rotation = 0, lineColor = {0,0,255}, fillColor = {0,0,255}, pattern = LinePattern.Solid, fillPattern = FillPattern.None, lineThickness = 0.25)}));
end testModel;
In the above code snippet of testModel, the rectangle and a polygon are added to the icon annotation of the model. Similarly, any user defined shape drawn on a Diagram View of the model will be added to the diagram annotation of the model.
Global head section in documentation
If you want to use same styles or same JavaScript for the classes contained inside a package then
you can define __OpenModelica_infoHeader annotation inside the Documentation annotation of a package.
For example,
package P
  model M
    annotation(Documentation(info="<html>
      <a href=\"javascript:HelloWorld()\">Click here</a>
    </html>"));
  end M;
 annotation(Documentation(__OpenModelica_infoHeader="
     <script type=\"text/javascript\">
       function HelloWorld() {
         alert(\"Hello World!\");
       }
     </script>"));
end P;
In the above example model M does not need to define the javascript function HelloWorld.
It is only defined once at the package level using the __OpenModelica_infoHeader and then all classes
contained in the package can use it.
In addition styles and JavaScript can be added from file locations using Modelica URIs. Example:
package P
  model M
    annotation(Documentation(info="<html>
      <a href=\"javascript:HelloWorld()\">Click here</a>
    </html>"));
  end M;
 annotation(Documentation(__OpenModelica_infoHeader="
     <script type=\"text/javascript\">
        src=\"modelica://P/Resources/hello.js\">
       }
     </script>"));
end P;
Where the file Resources/hello.js then contains:
function HelloWorld() {
  alert("Hello World!");
}
Settings
OMEdit allows users to save several settings which will be remembered across different sessions of OMEdit. The Options Dialog can be used for reading and writing the settings.
General
- General
- Language – Sets the application language.
- Working Directory – Sets the application working directory. All files are generated in this directory.
- Toolbar Icon Size – Sets the size for toolbar icons.
- Preserve User’s GUI Customizations – If true then OMEdit will remember its windows and toolbars positions and sizes.
- Terminal Command – Sets the terminal command. When user clicks on Tools > Open Terminal then this command is executed.
- Terminal Command Arguments – Sets the terminal command arguments.
- Hide Variables Browser – Hides the variable browser when switching away from plotting perspective.
- Libraries Browser
- Library Icon Size – Sets the size for library icons.
- Show Protected Classes – If enabled then Libraries Browser will also list the protected classes.
- Modeling View Mode
- Tabbed View/SubWindow View – Sets the view mode for modeling.
- Default View
- Icon View/DiagramView/Modelica Text View/Documentation View – If no preferredView annotation is defined then this setting is used to show the respective view when user double clicks on the class in the Libraries Browser.
- Enable Auto Save
- Auto Save interval – Sets the auto save interval value. The minimum possible interval value is 60 seconds.
- Enable Auto Save for single classes – Enables the auto save for one class saved in one file.
- Enable Auto Save for one file packages – Enables the auto save for packages saved in one file.
- Welcome Page
- Horizontal View/Vertical View – Sets the view mode for welcome page.
- Show Latest News – if true then displays the latest news.
Libraries
- System Libraries – The list of system libraries that should be loaded every time OMEdit starts.
- Force loading of Modelica Standard Library – If true then Modelica and ModelicaReference will always load even if user has removed them from the list of system libraries.
- Load OpenModelica library on startup – If true then OpenModelica package will be loaded when OMEdit is started.
- User Libraries – The list of user libraries/files that should be loaded every time OMEdit starts.
Text Editor
- Format
- Line Ending - Sets the file line ending.
- Byte Order Mark (BOM) - Sets the file BOM.
- Tabs and Indentation
- Tab Policy – Sets the tab policy to either spaces or tabs only.
- Tab Size – Sets the tab size.
- Indent Size – Sets the indent size.
- Syntax Highlight and Text Wrapping
- Enable Syntax Highlighting – Enable/Disable the syntax highlighting.
- Enable Code Folding - Enable/Disable the code folding. When code folding is enabled multi-line annotations are collapsed into a compact icon (a rectangle containing "...)"). A marker containing a "+" sign becomes available at the left-side of the involved line, allowing the code to be expanded/re-collapsed at will.
- Match Parentheses within Comments and Quotes – Enable/Disable the matching of parentheses within comments and quotes.
- Enable Line Wrapping – Enable/Disable the line wrapping.
- Font
- Font Family – Shows the names list of available fonts. Sets the font for the editor.
- Font Size – Sets the font size for the editor.
Modelica Editor
- Preserve Text Indentation – If true then uses diffModelicaFileListings API call otherwise uses the OMC pretty-printing.
- Colors
- Items – List of categories used of syntax highlighting the code.
- Item Color – Sets the color for the selected item.
- Preview – Shows the demo of the syntax highlighting.
MetaModelica Editor
- Colors
- Items – List of categories used of syntax highlighting the code.
- Item Color – Sets the color for the selected item.
- Preview – Shows the demo of the syntax highlighting.
CompositeModel Editor
- Colors
- Items – List of categories used of syntax highlighting the code.
- Item Color – Sets the color for the selected item.
- Preview – Shows the demo of the syntax highlighting.
C/C++ Editor
- Colors
- Items – List of categories used of syntax highlighting the code.
- Item Color – Sets the color for the selected item.
- Preview – Shows the demo of the syntax highlighting.
Graphical Views
- Extent
- Left – Defines the left extent point for the view.
- Bottom – Defines the bottom extent point for the view.
- Right – Defines the right extent point for the view.
- Top – Defines the top extent point for the view.
- Grid
- Horizontal – Defines the horizontal size of the view grid.
- Vertical – Defines the vertical size of the view grid.
- Component
- Scale factor – Defines the initial scale factor for the component
dragged on the view.
- Preserve aspect ratio – If true then the component’s aspect ratio
is preserved while scaling.
Simulation
- Simulation
- Matching Algorithm – sets the matching algorithm for simulation.
- Index Reduction Method – sets the index reduction method for simulation.
- Target Language – sets the target language in which the code is generated.
- Target Compiler – sets the target compiler for compiling the generated code.
- OMC Flags – sets the omc flags for simulation.
- Ignore __OpenModelica_commandLineOptions annotation – if ture then ignores the __OpenModelica_commandLineOptions annotation while running the simulation.
- Ignore __OpenModelica_simulationFlags annotation – if ture then ignores the __OpenModelica_simulationFlags annotation while running the simulation.
- Save class before simulation – if ture then always saves the class before running the simulation.
- Switch to plotting perspective after simulation – if ture then GUI always switches to plotting perspective after the simulation.
- Output
- Structured – Shows the simulation output in the form of tree structure.
- Formatted Text – Shows the simulation output in the form of formatted text.
Messages
- General
- Output Size - Specifies the maximum number of rows the Messages Browser may have. If there are more rows then the rows are removed from the beginning.
- Reset messages number before simulation – Resets the messages counter before starting the simulation.
- Font and Colors
- Font Family – Sets the font for the messages.
- Font Size – Sets the font size for the messages.
- Notification Color – Sets the text color for notification messages.
- Warning Color – Sets the text color for warning messages.
- Error Color – Sets the text color for error messages.
Notifications
- Notifications
- Always quit without prompt – If true then OMEdit will quit without prompting the user.
- Show item dropped on itself message – If true then a message will pop-up when a class is dragged and dropped on itself.
- Show model is defined as partial and component will be added as replaceable message – If true then a message will pop-up when a partial class is added to another class.
- Show component is declared as inner message – If true then a message will pop-up when an inner component is added to another class.
- Show save model for bitmap insertion message – If true then a message will pop-up when user tries to insert a bitmap from a local directory to an unsaved class.
- Always ask for the dragged component name – If true then a message will pop-up when user drag & drop the component on the graphical view.
Line Style
- Line Style
- Color – Sets the line color.
- Pattern – Sets the line pattern.
- Thickness – Sets the line thickness.
- Start Arrow – Sets the line start arrow.
- End Arrow – Sets the line end arrow.
- Arrow Size – Sets the start and end arrow size.
- Smooth – If true then the line is drawn as a Bezier curve.
Plotting
- General
- Auto Scale – sets whether to auto scale the plots or not.
- Plotting View Mode
- Tabbed View/SubWindow View – Sets the view mode for plotting.
- Curve Style
- Pattern – Sets the curve pattern.
- Thickness – Sets the curve thickness.
Figaro
- Figaro
- Figaro Library – the Figaro library file path.
- Tree generation options – the Figaro tree generation options file path.
- Figaro Processor – the Figaro processor location.
Debugger
- Algorithmic Debugger
- GDB Path – the gnu debugger path
- GDB Command Timeout – timeout for gdb commands.
- GDB Output Limit – limits the GDB output to N characters.
- Display C frames – if true then shows the C stack frames.
- Display unknown frames – if true then shows the unknown stack frames. Unknown stack frames means frames whose file path is unknown.
- Clear old output on a new run – if true then clears the output window on new run.
- Clear old log on new run – if true then clears the log window on new run.
- Transformational Debugger
- Always show Transformational Debugger after compilation – if true then always open the Transformational Debugger window after model compilation.
- Generate operations in the info xml – if true then adds the operations information in the info xml file.
FMI
- Export
- Version
- 1.0 – Sets the FMI export version to 1.0
- 2.0 – Sets the FMI export version to 2.0
- Type
- Model Exchange – Sets the FMI export type to Model Exchange.
- Co-Simulation – Sets the FMI export type to Co-Simulation.
- Model Exchange and Co-Simulation – Sets the FMI export type to Model Exchange and Co-Simulation.
- FMU Name – Sets a prefix for generated FMU file.
- Platforms - list of platforms to generate FMU binaries.
TLM
- General
- TLM Plugin Path - path to TLM plugin bin directory.
- TLM Manager Process - path to TLM managar process.
- TLM Monitor Process - path to TLM monitor process.
__OpenModelica_commandLineOptions Annotation
OpenModelica specific annotation to define the command line options needed to simulate the model. For example if you always want to simulate the model with a specific matching algorithm and index reduction method instead of the default ones then you can write the following code,
model Test
  annotation(__OpenModelica_commandLineOptions = "--matchingAlgorithm=BFSB --indexReductionMethod=dynamicStateSelection");
end Test;
The annotation is a space separated list of options where each option is either just a command line flag or a flag with a value.
In OMEdit right click inside the icon/diagram view of the model and choose Properties. Then OMC Flags and in the text field write --matchingAlgorithm=BFSB --indexReductionMethod=dynamicStateSelection.
If you want to ignore this annotation then use setCommandLineOptions("--ignoreCommandLineOptionsAnnotation=true"). In OMEdit Tools > Options > Simulation check Ignore __OpenModelica_commandLineOptions annotation.
__OpenModelica_simulationFlags Annotation
OpenModelica specific annotation to define the simulation options needed to simulate the model. For example if you always want to simulate the model with a specific solver instead of the default DASSL and would also like to see the cpu time then you can write the following code,
model Test
  annotation(__OpenModelica_simulationFlags(s = "heun", cpu = "()"));
end Test;
The annotation is a comma separated list of options where each option is a simulation flag with a value. For flags that doesn't have any value use () (See the above code example).
In OMEdit open the Simulation Setup and set the Simulation Flags then in the bottom check Save __OpenModelica_simulationFlags annotation inside model and click on OK.
If you want to ignore this annotation then use setCommandLineOptions("--ignoreSimulationFlagsAnnotation=true"). In OMEdit Tools > Options > Simulation check Ignore __OpenModelica_simulationFlags annotation.
Editing Modelica Standard Library
By default OMEdit loads the Modelica Standard Library (MSL) as a system library. System libraries are read-only. If you want to edit MSL you need to load it as user library instead of system library. We don't recommend editing MSL but if you really need to and understand the consequences then follow these steps,
- Go to Tools > Options > Libraries.
- Remove Modelica & ModelicaReference from list of system libraries.
- Uncheck force loading of Modelica Standard Library.
- Add $OPENMODELICAHOME/lib/omlibrary/Modelica X.X/package.mo under user libraries.
- Restart OMEdit.
State Machines
Creating a New Modelica State Class
Follow the same steps as defined in Creating a New Modelica Class. Additionally make sure you check the State checkbox.
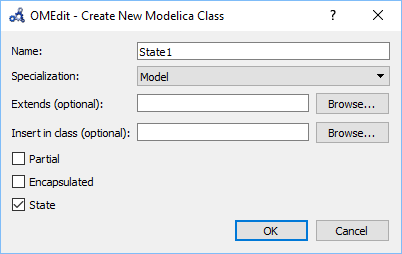
Figure 20 Creating a new Modelica state.
Making Transitions
In order to make a transition from one state to another the user first needs
to enable the transition mode ( ) from the toolbar.
Move the mouse over the state. The mouse cursor will change from arrow cursor to cross cursor. To start the transition press left button and move while keeping the button pressed. Now release the left button. Move towards the end state and click when cursor changes to cross cursor.
A Create Transition dialog box will appear which allows you to set the transition attributes. Cancelling the dialog will cancel the transition.
Double click the transition or right click and choose Edit Transition to modify the transition attributes.
State Machine Simulation
Support for Modelica state machines was added in the Modelica Language Specification v3.3. A subtle problem can occur if Modelica v3.2 libraries are loaded, e.g., the Modelica Standard Library v3.2.2, because in this case OMC automatically switches into Modelica v3.2 compatibility mode. Trying to simulate a state machine in Modelica v3.2 compatibility mode results in an error. It is possible to use the OMC flag --std=latest in order to ensure (at least) Modelica v3.3 support. In OMEdit this can be achieved by setting that flag in the Tools > Options > Simulation dialog.
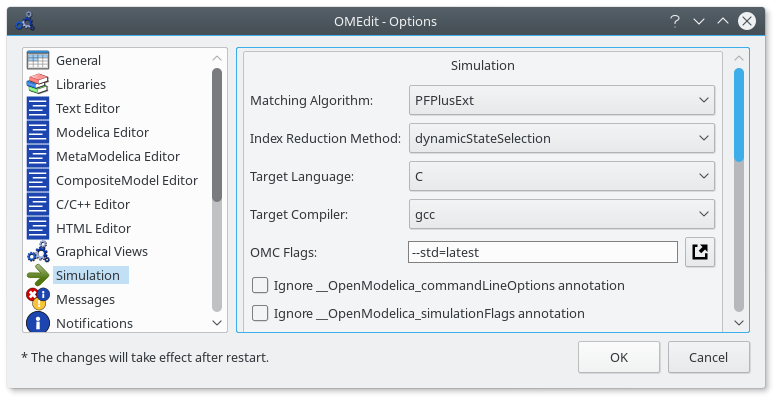
Figure 21 Ensure (at least) Modelica v3.3 support.