MDT Debugger for Algorithmic Modelica
The algorithmic code debugger, used for the algorithmic subset of the Modelica language as well as the MetaModelica language is described in Section The Eclipse-based Debugger for Algorithmic Modelica. Using this debugger replaces debugging of algorithmic code by primitive means such as print statements or asserts which is complex, time-consuming and error- prone. The usual debugging functionality found in debuggers for procedural or traditional object-oriented languages is supported, such as setting and removing breakpoints, stepping, inspecting variables, etc. The debugger is integrated with Eclipse.
The Eclipse-based Debugger for Algorithmic Modelica
The debugging framework for the algorithmic subset of Modelica and MetaModelica is based on the Eclipse environment and is implemented as a set of plugins which are available from Modelica Development Tooling (MDT) environment. Some of the debugger functionality is presented below. In the right part a variable value is explored. In the top-left part the stack trace is presented. In the middle-left part the execution point is presented.
The debugger provides the following general functionalities:
Adding/Removing breakpoints.
Step Over – moves to the next line, skipping the function calls.
Step In – takes the user into the function call.
- Step Return – complete the execution of the function and takes the
user back to the point from where the function is called.
Suspend – interrupts the running program.
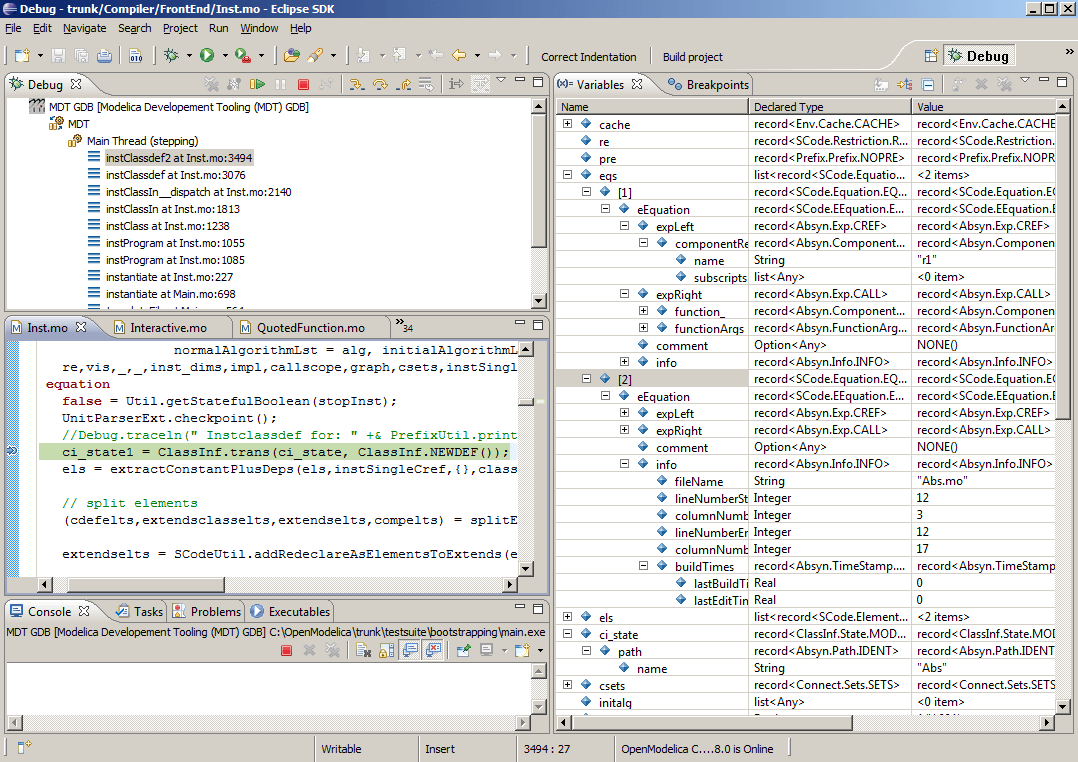
Figure 78 Debugging functionality.
Starting the Modelica Debugging Perspective
To be able to run in debug mode, one has to go through the following steps:
- create a mos file
- setting the debug configuration
- setting breakpoints
- running the debug configuration
All these steps are presented below using images.
Create mos file
In order to debug Modelica code we need to load the Modelica files into the OpenModelica Compiler. For this we can write a small script file like this:
function HelloWorld
  input Real r;
  output Real o;
algorithm
  o := 2 * r;
end HelloWorld;
>>> setCommandLineOptions({"-d=rml,noevalfunc","-g=MetaModelica"})
{true,true}
>>> setCFlags(getCFlags() + " -g")
true
>>> HelloWorld(120.0)
240.0
So lets say that we want to debug HelloWorld.mo. For that we must load
it into the compiler using the script file. Put all the Modelica files
there in the script file to be loaded. We should also initiate the
debugger by calling the starting function, in the above code
HelloWorld(120.0);
Setting the debug configuration
While the Modelica perspective is activated the user should click on the bug icon on the toolbar and select Debug in order to access the dialog for building debug configurations.
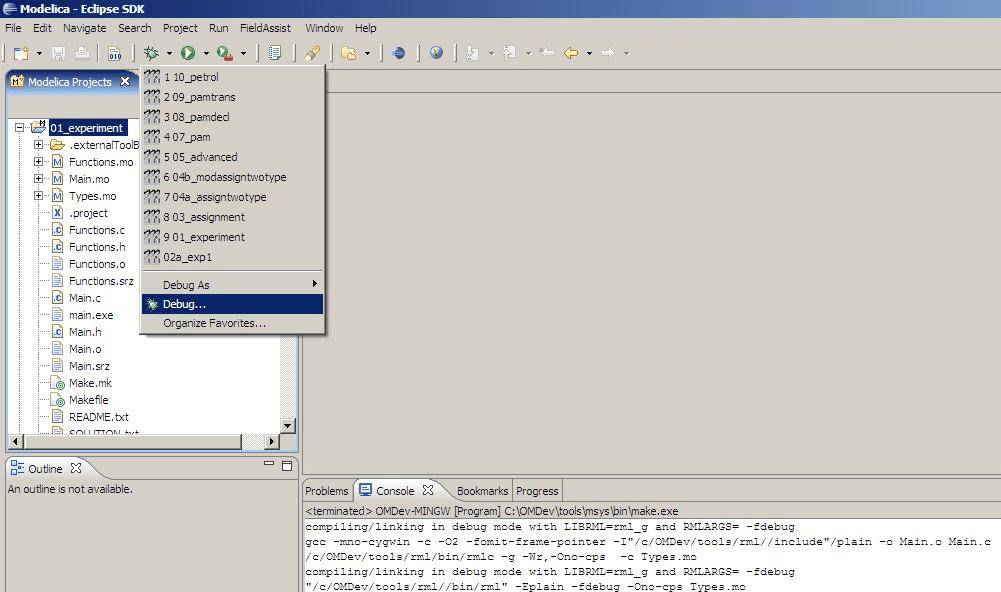
Figure 79 Accessing the debug configuration dialog.
To create the debug configuration, right click on the classification Modelica Development Tooling (MDT) GDB and select New as in figure below. Then give a name to the configuration, select the debugging executable to be executed and give it command line parameters. There are several tabs in which the user can select additional debug configuration settings like the environment in which the executable should be run.
Note that we require Gnu Debugger (GDB) for debugging session. We must specify the GDB location, also we must pass our script file as an argument to OMC.
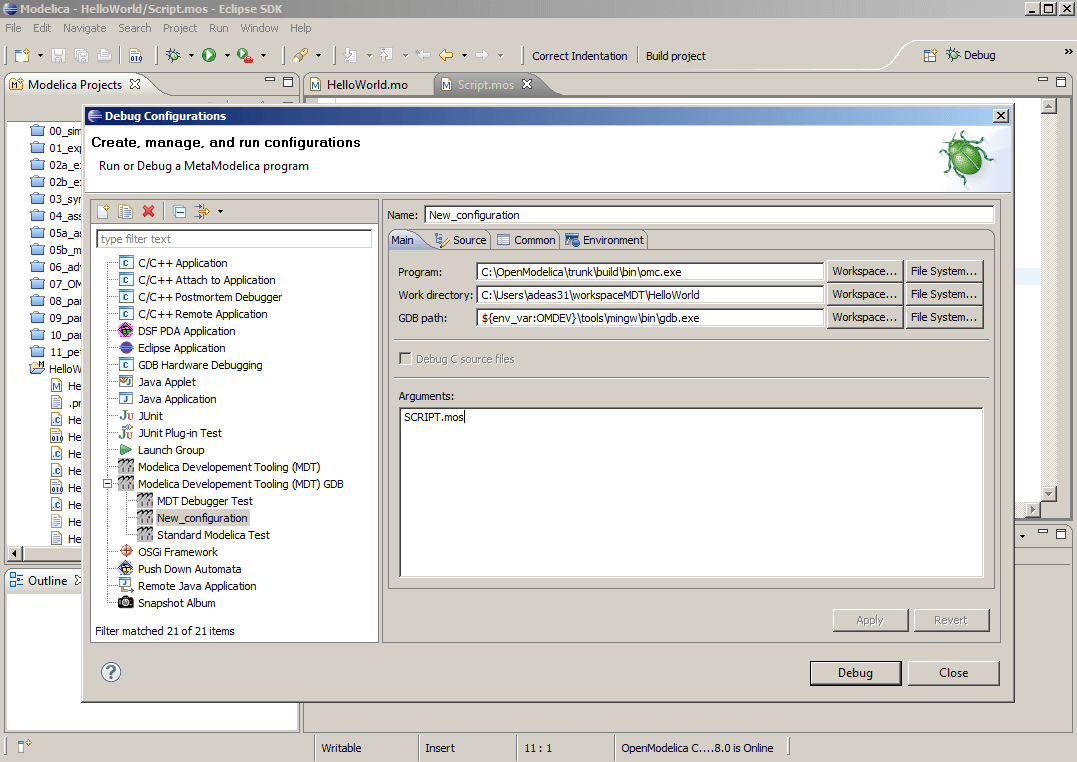
Figure 80 Creating the Debug Configuration.
Setting/Deleting Breakpoints
The Eclipse interface allows to add/remove breakpoints. At the moment only line number based breakpoints are supported. Other alternative to set the breakpoints is; function breakpoints.
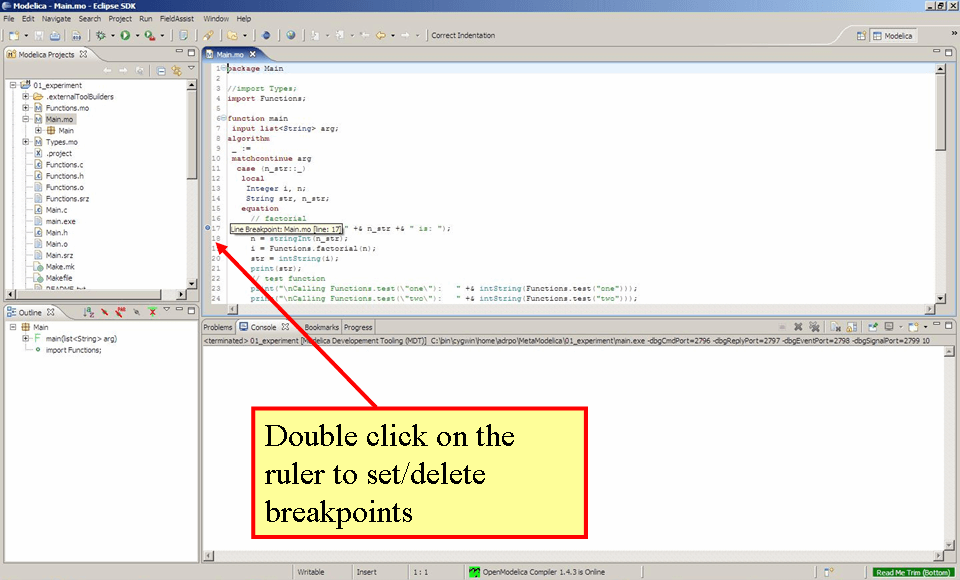
Figure 81 Setting/deleting breakpoints.
Starting the debugging session and enabling the debug perspective
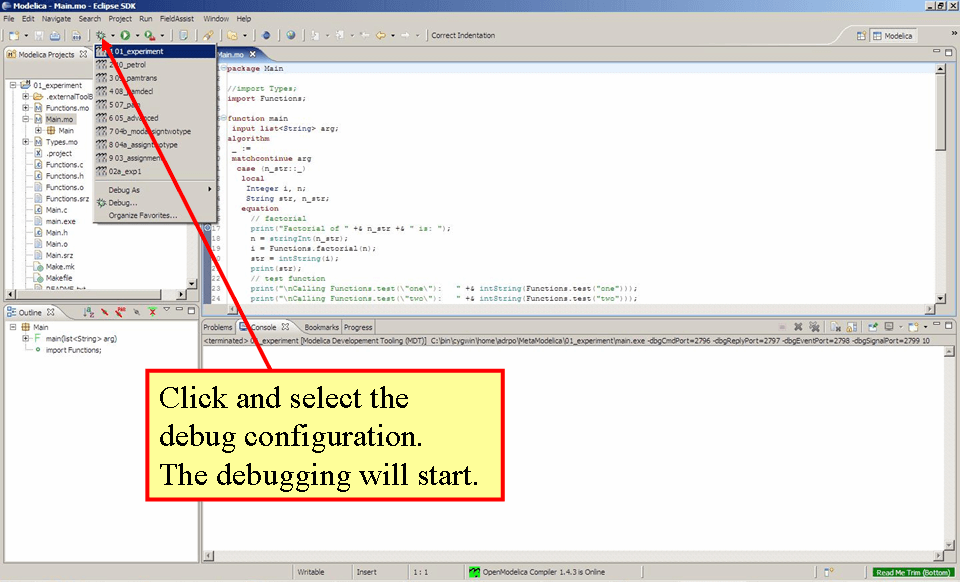
Figure 82 Starting the debugging session.
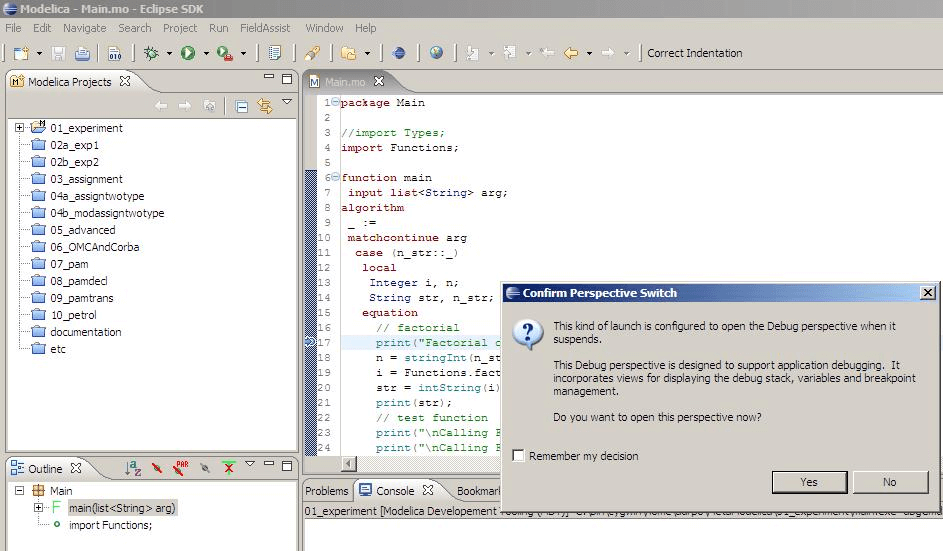
Figure 83 Eclipse will ask if the user wants to switch to the debugging perspective.
The Debugging Perspective
The debug view primarily consists of two main views:
- Stack Frames View
- Variables View
The stack frame view, shown in the figure below, shows a list of frames that indicates how the flow had moved from one function to another or from one file to another. This allows backtracing of the code. It is very much possible to select the previous frame in the stack and inspect the values of the variables in that frame. However, it is not possible to select any of the previous frame and start debugging from there. Each frame is shown as <function_name at file_name:line_number>.
The Variables view shows the list of variables at a certain point in the program, containing four colums:
- Name – the variable name.
- Declared Type – the Modelica type of the variable.
- Value – the variable value.
- Actual Type – the mapped C type.
By preserving the stack frames and variables it is possible to keep track of the variables values. If the value of any variable is changed while stepping then that variable will be highlighted yellow (the standard Eclipse way of showing the change).
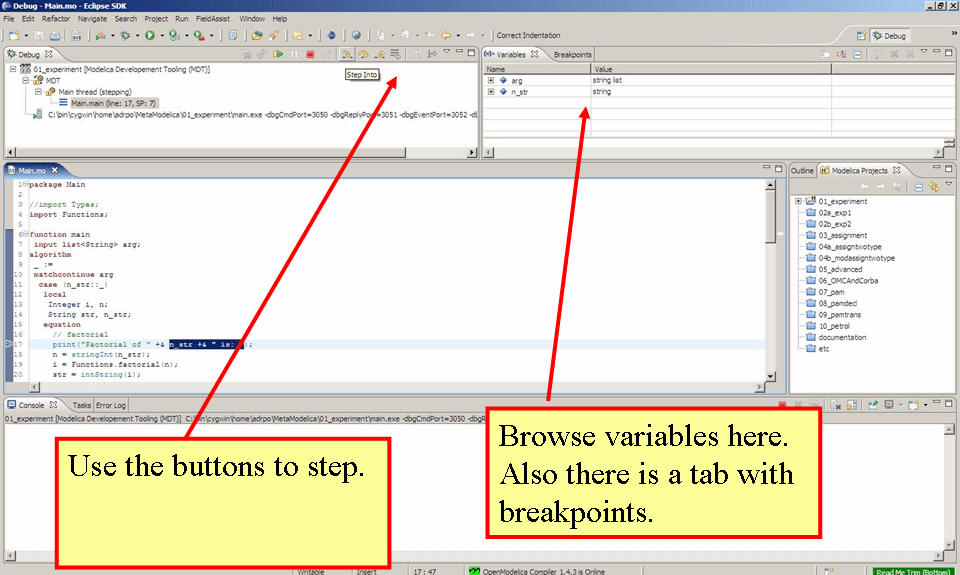
Figure 84 The debugging perspective.
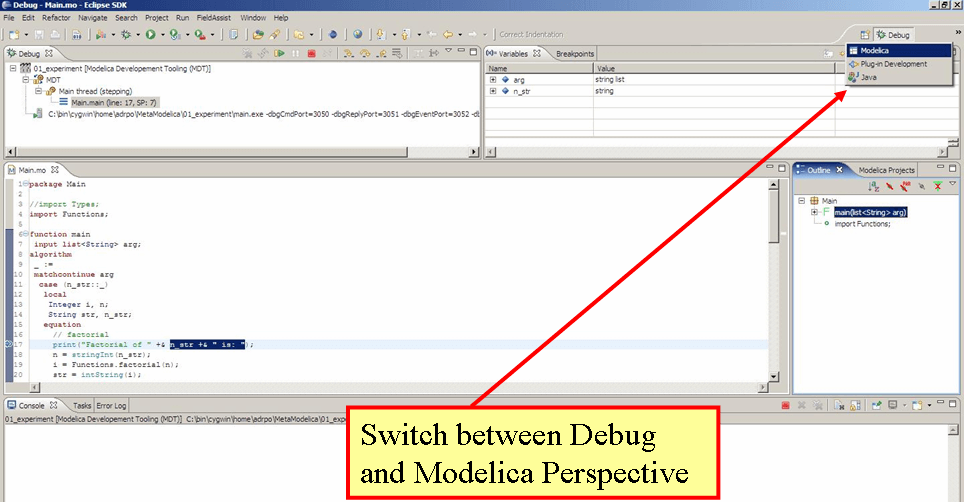
Figure 85 Switching between perspectives.