Debugging
There are two main ways to debug Modelica code, the transformations browser, which shows the transformations OpenModelica performs on the equations. There is also a debugger for debugging of algorithm sections and functions.
The Equation-based Debugger
This section gives a short description how to get started using the equation-based debugger in OMEdit.
Enable Tracing Symbolic Transformations
This enables tracing symbolic transformations of equations. It is optional but strongly recommended in order to fully use the debugger. The compilation time overhead from having this tracing on is less than 1%, however, in addition to that, some time is needed for the system to write the xml file containing the transformation tracing information.
Enable -d=infoXmlOperations in Tools->Options->Simulation (see section Simulation) OR alternatively click on the checkbox Generate operations in the info xml in Tools->Options->Debugger (see section Debugger) which performs the same thing.
This adds all the transformations performed by OpenModelica on the equations and variables stored in the model_info.xml file. This is necessary for the debugger to be able to show the whole path from the source equation(s) to the position of the bug.
Load a Model to Debug
Load an interesting model. We will use the package Debugging.mo since it contains suitable, broken models to demonstrate common errors.
Simulate and Start the Debugger
Select and simulate the model as usual. For example, if using the Debugging package, select the model Debugging.Chattering.ChatteringEvents1. If there is an error, you will get a clickable link that starts the debugger. If the user interface is unresponsive or the running simulation uses too much processing power, click cancel simulation first.
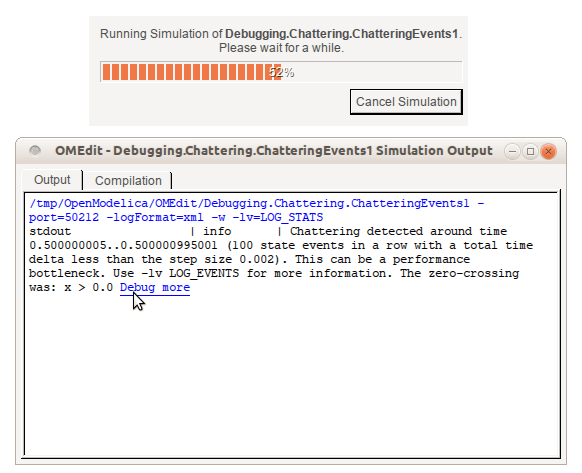
Figure 35 Simulating the model.
Use the Transformation Debugger for Browsing
The debugger opens on the equation where the error was found. You can browse through the dependencies (variables that are defined by the equation, or the equation is dependent on), and similar for variables. The equations and variables form a bipartite graph that you can walk.
If the -d=infoXmlOperations was used or you clicked the “generate operations” button, the operations performed on the equations and variables can be viewed. In the example package, there are not a lot of operations because the models are small.
Try some larger models, e.g. in the MultiBody library or some other library, to see more operations with several transformation steps between different versions of the relevant equation(s). If you do not trigger any errors in a model, you can still open the debugger, using File->Open Transformations File (model_info.json).
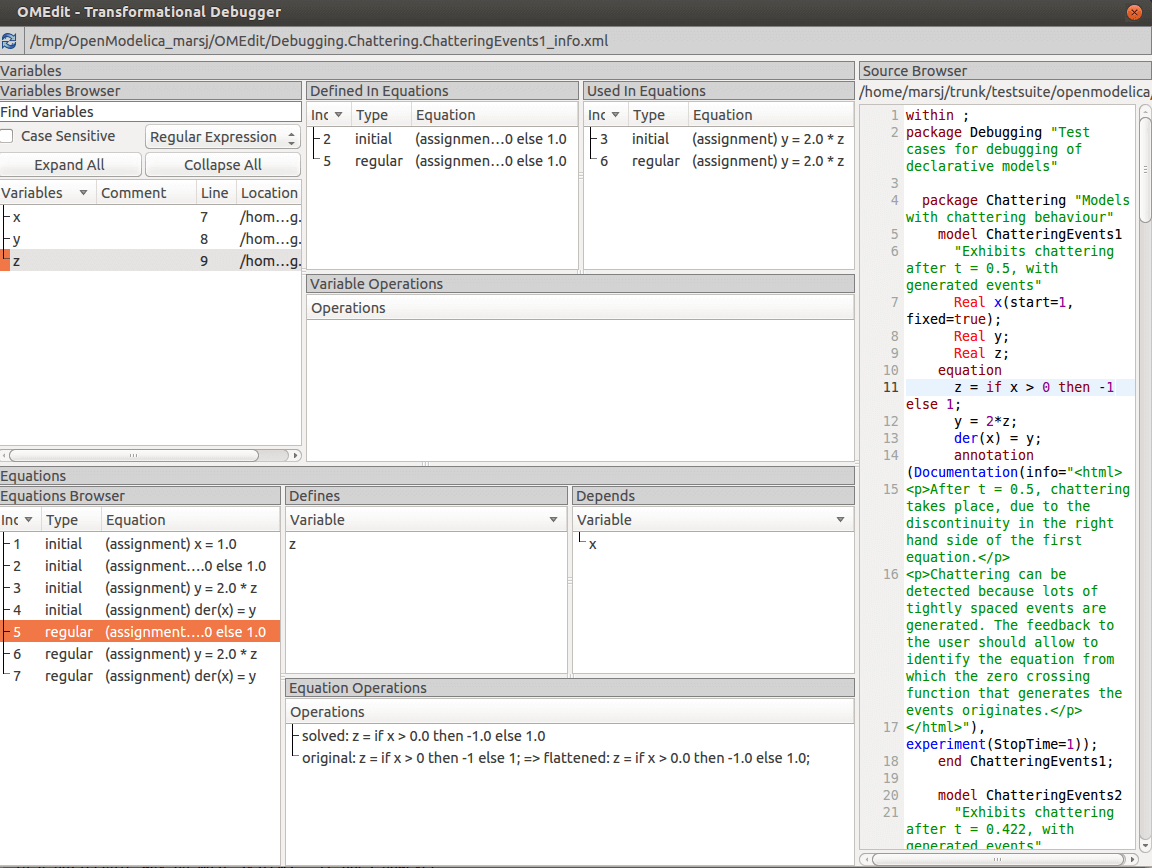
Figure 36 Transfomations Browser.
The Algorithmic Debugger
This section gives a short description how to get started using the algorithmic debugger in OMEdit. See section Simulation for further details of debugger options.
Adding Breakpoints
There are two ways to add the breakpoints,
Click directly on the line number in Text View, a red circle is created indicating a breakpoint as shown in Figure 37.
Open the Algorithmic Debugger window and add a breakpoint using the right click menu of Breakpoints Browser window.
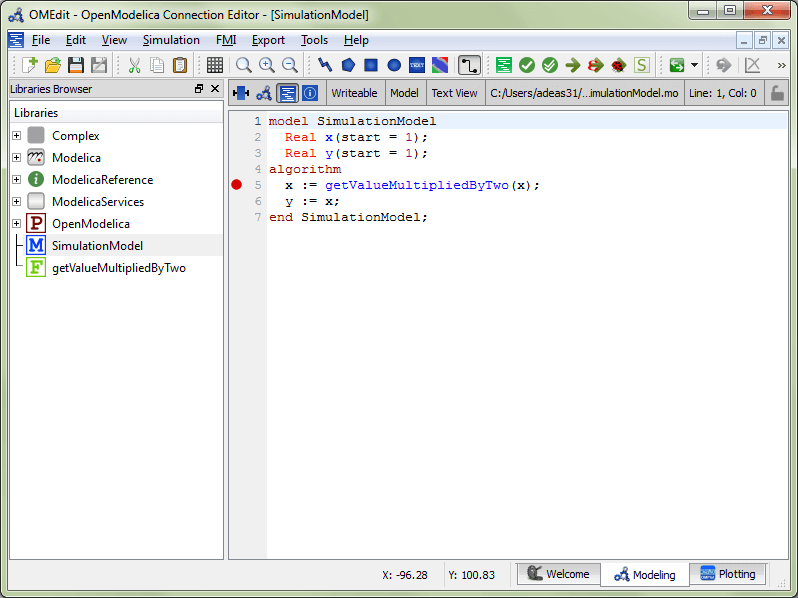
Figure 37 Adding breakpoint in Text View.
Start the Algorithmic Debugger
You should add breakpoints before starting the debugger because sometimes the simulation finishes quickly and you won’t get any chance to add the breakpoints.
There are four ways to start the debugger,
Open the Simulation Setup and click on Launch Algorithmic Debugger before pressing Simulate.
Right click the model in Libraries Browser and select Simulate with Algorithmic Debugger.
Open the Algorithmic Debugger window and from menu select Debug-> Debug Configurations.
Open the Algorithmic Debugger window and from menu select Debug-> Attach to Running Process.
Debug Configurations
If you already have a simulation executable with debugging symbols outside of OMEdit then you can use the Debug->Debug Configurations option to load it.
The debugger also supports MetaModelica data structures so one can debug omc executable. Select omc executable as program and write the name of the mos script file in Arguments.
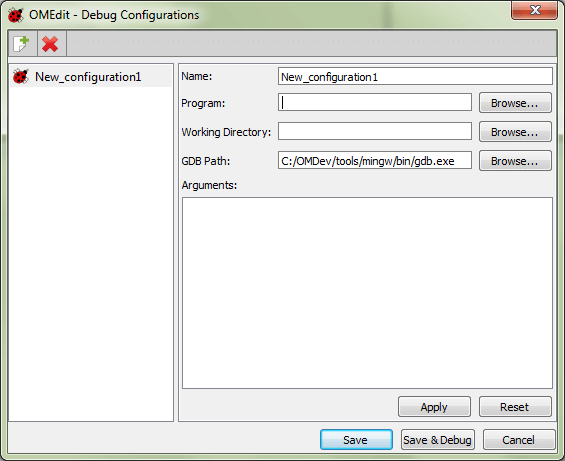
Figure 38 Debug Configurations.
Attach to Running Process
If you already have a running simulation executable with debugging symbols outside of OMEdit then you can use the Debug->Attach to Running Process option to attach the debugger with it. Figure 39 shows the Attach to Running Process dialog. The dialog shows the list of processes running on the machine. The user selects the program that he/she wish to debug. OMEdit debugger attaches to the process.
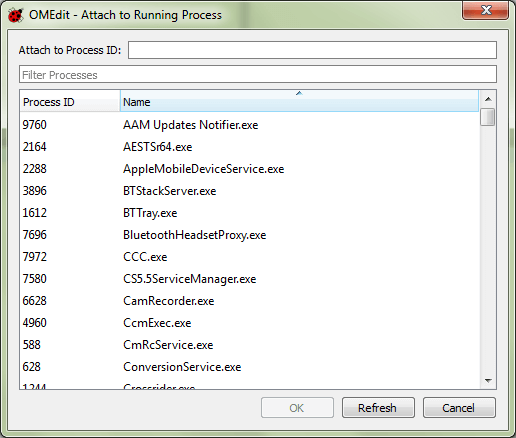
Figure 39 Attach to Running Process.
Using the Algorithmic Debugger Window
Figure 40 shows the Algorithmic Debugger window. The window contains the following browsers,
Stack Frames Browser – shows the list of frames. It contains the program context buttons like resume, interrupt, exit, step over, step in, step return. It also contains a threads drop down which allows switching between different threads.
BreakPoints Browser – shows the list of breakpoints. Allows adding/editing/removing breakpoints.
Locals Browser – Shows the list of local variables with values. Select the variable and the value will be shown in the bottom right window. This is just for convenience because some variables might have long values.
Debugger CLI – shows the commands sent to gdb and their responses. This is for advanced users who want to have more control of the debugger. It allows sending commands to gdb.
Output Browser – shows the output of the debugged executable.
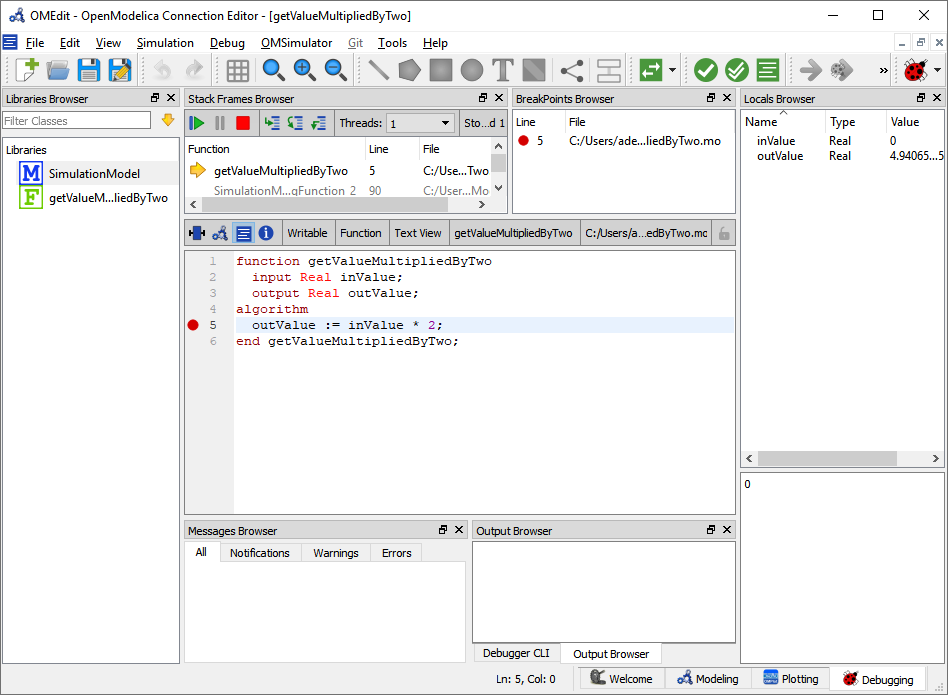
Figure 40 Algorithmic Debugger.
